Custom charts
When the standard Microreact charts don't provide the visualisation you need, you can create a custom chart. The Custom Chart option uses a Vega-Lite script to program the visual.
First, users can browse the Vega gallery to get ideas for potential visuals to include in your project: https://vega.github.io/vega-lite/examples/
Once you know the visual you want to create, you can use Vega-lite Editor (an in-browser tool NOT managed by CGPS) to build and run your code: https://vega.github.io/editor/#/custom/vega-lite

The Vega-lite Editor can help to ensure users that their chart is visualising their data as intended. The editor requires access to data in order to test and troubleshoot. To get your data into the Vega-lite editor you can host your file anywhere the provides a publicly accessible link to the data file (your own website, cloud account, etc.) If that's not a convenient option, you can easily create a Github Gist. With a Gist, you can either make it public, or create a secret Gist. Important information about the privacy of secret Gists is available at Github's website. A demonstration of how to create a Gist and use that in the Vega-lite editor is available in video below.

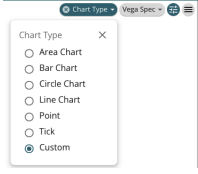
Once you have created your Vega-lite script, head to your Microreact project. Create a New Chart specifying Custom as the chart type.

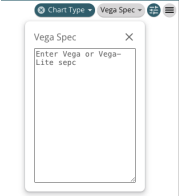
Copy your Vega-Lite script from the Vega Editor and paste it into the Vega Spec lozenge in the custom chart panel.

Last updated