Microreact
  • Introduction
  • Introductory Videos
  • About Microreact
    • Privacy and Terms Of Service
    • Open source software used by Microreact
    • Change Log
  • Instructions
    • Navigating the site
      • Managing Projects
    • Navigating within a project
      • History sidebar
      • Selection sidebar
      • Views Sidebar
    • Creating a Project
      • Supported File Formats
      • Metadata Data
      • Tree Data
      • Map Data
      • Timeline Data
      • Network Data
      • Matrix Data
    • Adding and Editing Panels
      • Data Table
      • Map
      • Timeline
      • Tree
      • Network
      • Data-slicer
      • Chart overview
        • Area Chart
        • Line Chart
        • Bar Chart
        • Circle, Tick, Point Charts
        • Custom charts
        • Pie Chart
        • Multi-variable Chart
        • Heatmap
      • Note Panel
      • Matrix
    • Selecting and Filtering Data
    • Labels, Colours, and Shapes
    • Saving and version control
    • Access Control and Project Sharing
      • Download Project Files
      • URL control options
    • Tips & FAQ
      • How to Link Microreact projects to Google Sheets
  • API
    • API Access Tokens
    • Creating Projects via API
    • Updating Projects via API
    • Deleting Projects via API
    • Sharing Projects via API
    • Migrating to the new API
  • Feedback
    • Contact the Microreact team
Powered by GitBook
On this page

Was this helpful?

  1. Instructions
  2. Adding and Editing Panels

Matrix

PreviousNote PanelNextSelecting and Filtering Data

Last updated 1 year ago

Was this helpful?

Matrix

The matrix panel creates a heatmap or a graphical representation of data organised in a matrix format, with rows and columns representing different variables or categories. Each cell in the matrix corresponds to a specific combination of row and column variables and is often encoded using a gradient of colours. See Matrix Data for data source guidance.

Format

There are several ways to format the matrix using the menu in the Labels losenge.
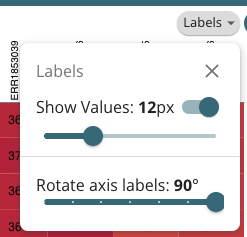
Show values:

First, users can choose to show cell labels. These values can be toggled on/off at the users discretion using the Show Values button in the labels losenge.

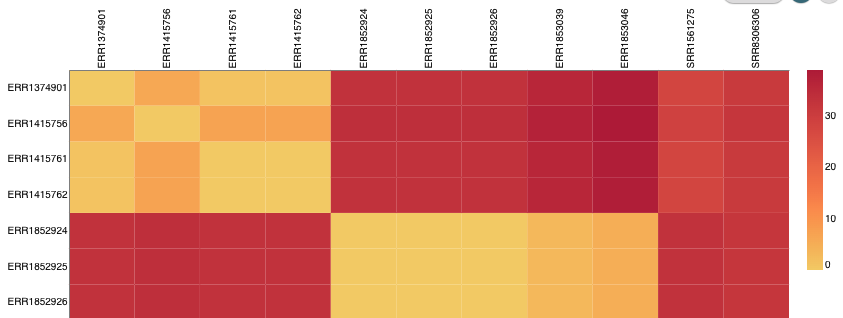
Rotate axis labels:

Secondly, users can choose the angle at which the top row labels appear. Users can select from a range of 0 degrees (completely flat/ horizontal) to 90 degrees (complete straight/ vertical).